I Invented a New Metric to See If Work is Actually Happening


A few years ago, as an Agile Performance Lead, I worked with a team that was deeply frustrated. During their retrospectives, they kept complaining that they could not work as a team. They had so many unrelated tasks that each developer was working on something completely different. There was zero knowledge exchange, difficulty getting help, and a feeling of being assigned to a topic “until the end of time.”
They had a “gut feeling” about the problem, but they could not quantify it.
The Flaw in “Classic” Work-in-Progress (WIP)
The standard approach in such a case is to use a Work in Progress (WIP) metric—counting the number of tasks developers have pulled into active work.
But I did not need to research how others measure WIP. I knew from first principles that simply counting open tasks was a flawed idea. Why? Because a ticket can hang in an In Progress status for weeks, being effectively blocked, idle, or forgotten. It measures a state, not an activity. It does not show if any real work is happening.
Inventing a Better Metric: “Active WIP”
So, from the ground up, I created a different metric, which I call Active WIP.
Instead of counting tickets in a certain status, it counts the number of status changes per task, per day.
The logic is simple: Active WIP is a measure of the heartbeat of the work. If a task’s status is changing, it is alive. If it is silent, it is likely to be idle or blocked, no matter what its In Progress label says. It can be also in a long phase of deep work, but it’s exactly what needs to be examined for such a task.
This gives us several advantages:
We know how frequently work is happening.
We can see the flow: are status changes smooth and daily, or are there bursts of activity separated by long pauses?
We can spot patterns, like context switching between two tasks that are both supposedly “in progress.”
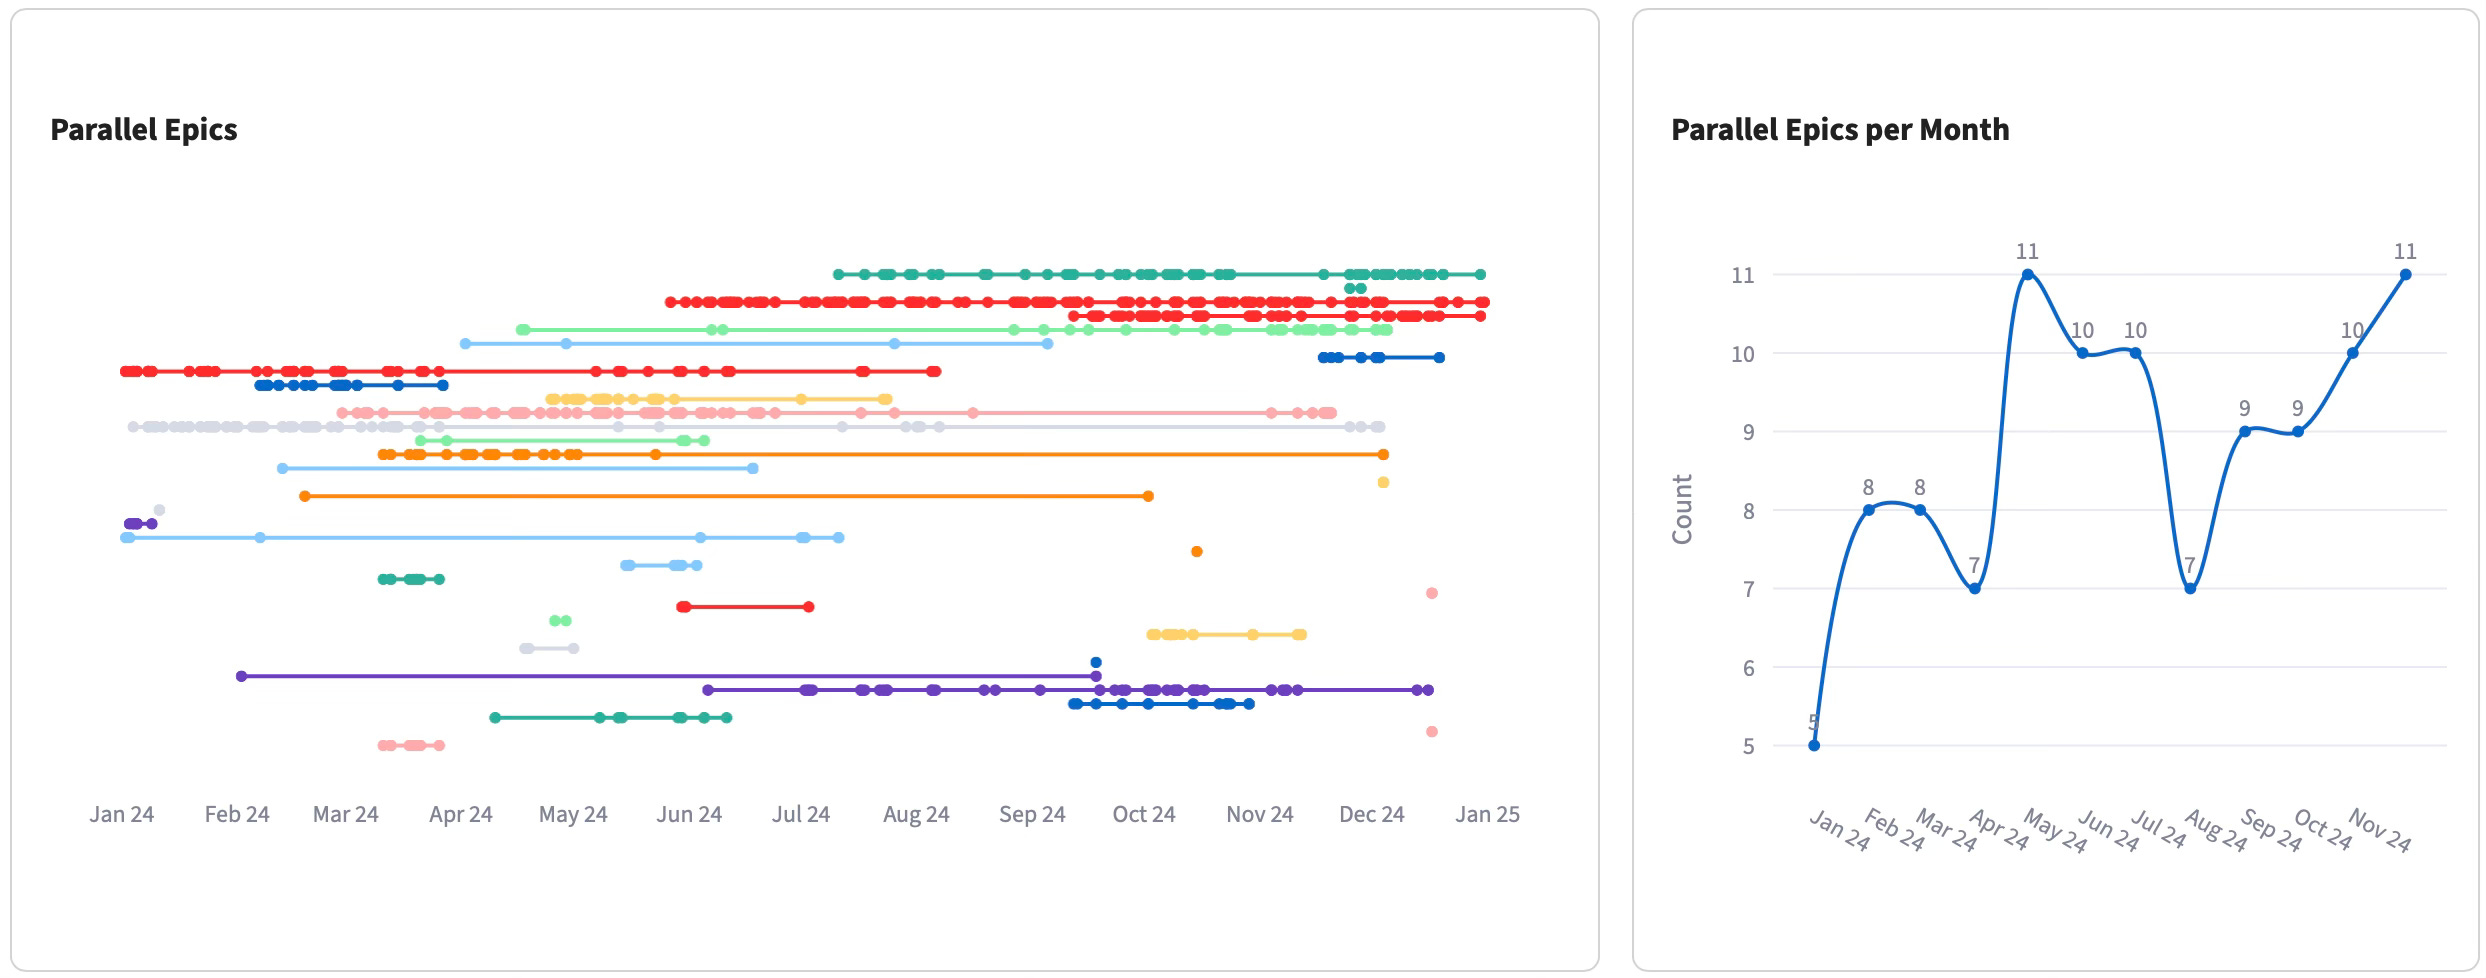
We can aggregate this activity to the Epic level to see how many large value streams are being worked on at the same time.
The Payoff: An Empowered Team
So what happened to the team that started this story?
We used Active WIP to visualize their fragmentation. The data confirmed their gut feeling. Together with their Product Owner, they reviewed the backlog, re-prioritized tasks, and for a while, they worked much more as a cohesive team.
The most interesting part? After a few months, the problem of fragmentation started to return. Entropy is inevitable. But this time, no one was particularly worried. Why?
They now had a tool that clearly showed them when their focus was becoming fragmented again.
They realized that this “entropy” is a natural part of complex work and that they would simply have to periodically repeat the exercise of reviewing and re-focusing their efforts.
My metric did not “solve” their problem forever. It empowered them by making the problem visible and manageable. It gave them a warning light for their process.
Going Deeper: Active WIP vs. Flow Efficiency
You might ask, How does this relate to advanced flow metrics like Flow Efficiency?
My platform, OrgAI, also fully automates the calculation of Flow Efficiency. It is a “gold standard” metric that answers the question: “How much time are we wasting on waiting?”
But Active WIP gives me a powerful, complementary insight.
Flow Efficiency tells you how much time was active vs. waiting.
Active WIP tells you how intensely and dynamically the work was managed during its active phases.
It answers the question: Is the team actively managing the flow of their work, or are tasks just hanging in ‘active’ statuses without updates? It is a measure of the team’s engagement with their own workflow.
This is my unique value: I not only use the gold standard, but I have also built new, innovative tools to gain an even deeper layer of understanding. And I did not copy them. I built them from first principles, driven by real-world problems.
The Golden Rule
For any of this to work, there is one golden rule: your ticketing system (Jira, etc.) must be a natural communication tool for the team, not a reporting system for management. If status updates are a chore done for the boss, all this data becomes meaningless. The tool must serve the people doing the work.
Take the Next Step
Does your team have a ‘gut feeling’ about a process problem but lacks the data to prove it? Standard metrics might be hiding the truth. Let’s talk about how custom, intelligent metrics can give you the clarity you need to make real improvements.